3. Historical Data
This section illustrates how to retrieve historical data for different instruments.
First, the API connection.
In [1]:
import fxcmpy
import pandas as pd
import datetime as dt
con = fxcmpy.fxcmpy(config_file='fxcm.cfg')
3.1. Available Instruments
A list of instruments for which historical data is available is
returned by con. get_instruments_for_candles().
In [2]:
instruments = con.get_instruments_for_candles()
for i in range(int(len(instruments)/4)):
    print(instruments[i*4:(i+1)*4])
print(instruments[(i+1)*4:])
['AUD/CAD', 'AUD/CHF', 'AUD/JPY', 'AUD/NZD']
['AUD/USD', 'AUS200', 'Bund', 'CAD/CHF']
['CAD/JPY', 'CHF/JPY', 'CHN50', 'Copper']
['ESP35', 'EUR/AUD', 'EUR/CAD', 'EUR/CHF']
['EUR/GBP', 'EUR/JPY', 'EUR/NOK', 'EUR/NZD']
['EUR/SEK', 'EUR/TRY', 'EUR/USD', 'EUSTX50']
['FRA40', 'GBP/AUD', 'GBP/CAD', 'GBP/CHF']
['GBP/JPY', 'GBP/NZD', 'GBP/USD', 'GER30']
['HKG33', 'JPN225', 'NAS100', 'NGAS']
['NZD/CAD', 'NZD/CHF', 'NZD/JPY', 'NZD/USD']
['SOYF', 'SPX500', 'TRY/JPY', 'UK100']
['UKOil', 'US30', 'USD/CAD', 'USD/CHF']
['USD/CNH', 'USD/HKD', 'USD/JPY', 'USD/MXN']
['USD/NOK', 'USD/SEK', 'USD/TRY', 'USD/ZAR']
['USDOLLAR', 'USOil', 'XAG/USD', 'XAU/USD']
['ZAR/JPY']
3.2. Fetching the Data
In a simple case, the con.get_candles() method returns the most
recent data points available for a specified instrument and
period value.
In [3]:
con.get_candles('USD/JPY', period='D1') # daily data
Out[3]:
| bidopen | bidclose | bidhigh | bidlow | askopen | askclose | askhigh | asklow | tickqty | |
|---|---|---|---|---|---|---|---|---|---|
| date | |||||||||
| 2018-07-03 21:00:00 | 110.886 | 110.563 | 111.125 | 110.498 | 110.908 | 110.625 | 111.147 | 110.518 | 297494 |
| 2018-07-04 21:00:00 | 110.563 | 110.470 | 110.598 | 110.267 | 110.625 | 110.526 | 110.652 | 110.288 | 295074 |
| 2018-07-05 21:00:00 | 110.470 | 110.579 | 110.731 | 110.278 | 110.526 | 110.708 | 110.755 | 110.300 | 316198 |
| 2018-07-06 21:00:00 | 110.579 | 110.439 | 110.777 | 110.369 | 110.708 | 110.509 | 110.798 | 110.392 | 267247 |
| 2018-07-08 21:00:00 | 110.400 | 110.400 | 110.422 | 110.290 | 110.459 | 110.456 | 110.489 | 110.315 | 713 |
| 2018-07-09 21:00:00 | 110.401 | 110.836 | 110.893 | 110.340 | 110.457 | 110.859 | 110.914 | 110.362 | 226624 |
| 2018-07-10 21:00:00 | 110.835 | 110.977 | 111.343 | 110.781 | 110.858 | 111.016 | 111.365 | 110.816 | 226709 |
| 2018-07-11 21:00:00 | 110.977 | 111.980 | 112.163 | 110.757 | 111.016 | 112.053 | 112.183 | 110.776 | 385668 |
| 2018-07-12 21:00:00 | 111.981 | 112.524 | 112.617 | 111.905 | 112.054 | 112.557 | 112.638 | 111.929 | 302315 |
| 2018-07-13 21:00:00 | 112.523 | 112.319 | 112.790 | 112.266 | 112.556 | 112.352 | 112.811 | 112.287 | 252067 |
By default, the method returns a pandas DataFrame object which
simplifies the majority of typical analytics and visualizations tasks
significantly (see http://pandas.pydata.org).
3.3. Data Frequency
The parameter period defines the frequency of the data to be
retrieved. Below is a list of all currently available frequencies.
- minutes:
m1,m5,m15andm30, - hours:
H1,H2,H3,H4,H6andH8, - one day:
D1, - one week:
W1, - one month:
M1.
By default, con.get_candles() returns data for the last 10 available
periods, depending on the parameter value for period.
In [4]:
con.get_candles('EUR/USD', period='M1') # monthly data
Out[4]:
| bidopen | bidclose | bidhigh | bidlow | askopen | askclose | askhigh | asklow | tickqty | |
|---|---|---|---|---|---|---|---|---|---|
| date | |||||||||
| 2017-08-31 21:00:00 | 1.19081 | 1.18108 | 1.20913 | 1.17160 | 1.19110 | 1.18197 | 1.20937 | 1.17181 | 6183348 |
| 2017-09-30 21:00:00 | 1.18108 | 1.16450 | 1.18792 | 1.15731 | 1.18197 | 1.16476 | 1.18810 | 1.15750 | 4598301 |
| 2017-10-31 21:00:00 | 1.16450 | 1.19026 | 1.19601 | 1.15528 | 1.16476 | 1.19051 | 1.19624 | 1.15549 | 4392023 |
| 2017-11-30 22:00:00 | 1.19026 | 1.20038 | 1.20244 | 1.17165 | 1.19051 | 1.20103 | 1.20267 | 1.17187 | 3678417 |
| 2017-12-31 22:00:00 | 1.20038 | 1.24122 | 1.25369 | 1.19144 | 1.20103 | 1.24148 | 1.25392 | 1.19166 | 6771090 |
| 2018-01-31 22:00:00 | 1.24122 | 1.21922 | 1.25547 | 1.21867 | 1.24148 | 1.21962 | 1.25566 | 1.21890 | 6552190 |
| 2018-02-28 21:00:00 | 1.21922 | 1.23198 | 1.24752 | 1.21534 | 1.21962 | 1.23270 | 1.24777 | 1.21556 | 5786487 |
| 2018-03-31 21:00:00 | 1.23198 | 1.20765 | 1.24126 | 1.20544 | 1.23270 | 1.20789 | 1.24150 | 1.20566 | 4715448 |
| 2018-04-30 21:00:00 | 1.20765 | 1.16890 | 1.20831 | 1.15091 | 1.20789 | 1.16963 | 1.20855 | 1.15113 | 7100027 |
| 2018-05-31 21:00:00 | 1.16890 | 1.16805 | 1.18512 | 1.15069 | 1.16963 | 1.16872 | 1.18535 | 1.15094 | 6660473 |
A number different from 10 can also be defined via the number
parameter.
In [5]:
con.get_candles('EUR/USD', period='m1', number=5) # five one-minute bars
Out[5]:
| bidopen | bidclose | bidhigh | bidlow | askopen | askclose | askhigh | asklow | tickqty | |
|---|---|---|---|---|---|---|---|---|---|
| date | |||||||||
| 2018-07-13 20:55:00 | 1.16848 | 1.16850 | 1.16851 | 1.16841 | 1.16874 | 1.16877 | 1.16878 | 1.16868 | 61 |
| 2018-07-13 20:56:00 | 1.16850 | 1.16846 | 1.16854 | 1.16844 | 1.16877 | 1.16874 | 1.16879 | 1.16872 | 67 |
| 2018-07-13 20:57:00 | 1.16846 | 1.16842 | 1.16846 | 1.16841 | 1.16874 | 1.16870 | 1.16874 | 1.16868 | 13 |
| 2018-07-13 20:58:00 | 1.16842 | 1.16847 | 1.16855 | 1.16842 | 1.16870 | 1.16878 | 1.16883 | 1.16870 | 37 |
| 2018-07-13 20:59:00 | 1.16847 | 1.16831 | 1.16847 | 1.16831 | 1.16878 | 1.16879 | 1.16879 | 1.16878 | 5 |
3.4. Time Windows
Alternatively, one can specifiy start and stop values to
specifiy the time window for data retrieval.
In [6]:
start = dt.datetime(2018, 5, 15)
end = dt.datetime(2018, 6, 1)
con.get_candles('EUR/USD', period='D1',
                start=start, end=end)
Out[6]:
| bidopen | bidclose | bidhigh | bidlow | askopen | askclose | askhigh | asklow | tickqty | |
|---|---|---|---|---|---|---|---|---|---|
| date | |||||||||
| 2018-05-16 21:00:00 | 1.18366 | 1.18057 | 1.18530 | 1.17620 | 1.18389 | 1.18087 | 1.18553 | 1.17644 | 398017 |
| 2018-05-17 21:00:00 | 1.18057 | 1.17920 | 1.18363 | 1.17752 | 1.18087 | 1.17964 | 1.18388 | 1.17776 | 307611 |
| 2018-05-18 21:00:00 | 1.17920 | 1.17674 | 1.18210 | 1.17486 | 1.17964 | 1.17754 | 1.18234 | 1.17509 | 212112 |
| 2018-05-20 21:00:00 | 1.17674 | 1.17668 | 1.17785 | 1.17623 | 1.17754 | 1.17745 | 1.17811 | 1.17699 | 168 |
| 2018-05-21 21:00:00 | 1.17668 | 1.17903 | 1.17945 | 1.17155 | 1.17745 | 1.17928 | 1.17968 | 1.17179 | 193762 |
| 2018-05-22 21:00:00 | 1.17903 | 1.17772 | 1.18287 | 1.17553 | 1.17928 | 1.17809 | 1.18310 | 1.17578 | 275263 |
| 2018-05-23 21:00:00 | 1.17772 | 1.16944 | 1.17886 | 1.16747 | 1.17809 | 1.16980 | 1.17909 | 1.16770 | 376471 |
| 2018-05-24 21:00:00 | 1.16944 | 1.17182 | 1.17494 | 1.16897 | 1.16980 | 1.17206 | 1.17516 | 1.16921 | 320235 |
| 2018-05-25 21:00:00 | 1.17182 | 1.16469 | 1.17325 | 1.16447 | 1.17206 | 1.16529 | 1.17349 | 1.16473 | 313961 |
| 2018-05-27 21:00:00 | 1.16469 | 1.16849 | 1.16869 | 1.16534 | 1.16529 | 1.16886 | 1.16907 | 1.16597 | 947 |
| 2018-05-28 21:00:00 | 1.16849 | 1.16232 | 1.17273 | 1.16063 | 1.16886 | 1.16260 | 1.17297 | 1.16085 | 243549 |
| 2018-05-29 21:00:00 | 1.16232 | 1.15383 | 1.16385 | 1.15091 | 1.16260 | 1.15408 | 1.16409 | 1.15113 | 418712 |
| 2018-05-30 21:00:00 | 1.15383 | 1.16599 | 1.16753 | 1.15176 | 1.15408 | 1.16673 | 1.16774 | 1.15199 | 431775 |
| 2018-05-31 21:00:00 | 1.16599 | 1.16890 | 1.17233 | 1.16400 | 1.16673 | 1.16963 | 1.17254 | 1.16423 | 380182 |
| 2018-06-01 21:00:00 | 1.16890 | 1.16561 | 1.17168 | 1.16166 | 1.16963 | 1.16625 | 1.17194 | 1.16190 | 309563 |
3.5. Data Visualization
The Python ecosystem provides a number of alternatives to visualize
financial time series data. The standard plotting library is
matplotlib (see http://matplotlib.org) which is tighly integrated
with pandas DataFrame objects, allowing for efficient
visualizations.
In [7]:
from pylab import plt
plt.style.use('seaborn')
%matplotlib inline
Using the columns parameter, one can specifiy which data columns are
returned. Here, just one column is specified.
In [8]:
data = con.get_candles('EUR/USD', period='m1',
                       columns=['askopen'], number=500)
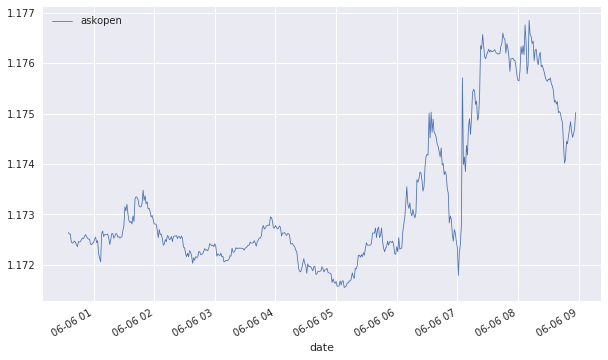
The following code visualizes the only financial time series in the
DataFrame object.
In [9]:
data.plot(figsize=(10, 6), lw=0.8);

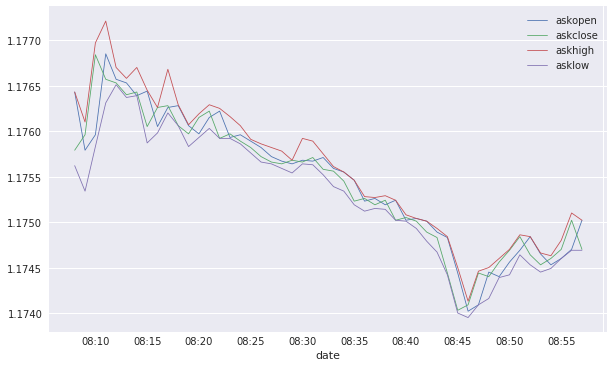
Specifying the columns parameter to be asks (bids) returns
all columns related to ask (bid) prices.
In [10]:
data = con.get_candles('EUR/USD', period='m1',
                       columns=['asks'], number=50)
In [11]:
data.plot(figsize=(10, 6), lw=0.8);

In [12]:
con.close()
